
For politicians, celebrities, journalists, the United Nations, and Pope Francis, the belief that humanity is causing a steep rise in temperature of the Earth’s atmosphere is more than just a theory, it’s an article of faith. According to this belief, man’s production of greenhouse gases, particularly carbon dioxide, is the primary cause of an unprecedented warming currently underway. If we do not take action, they claim, the world will suffer apocalyptic consequences. Many ordinary citizens have accepted this theory if for no other reason that an impressive body of governments and scientific institutions have endorsed it.
There is only one problem with this theory: it is not proven or supported by facts.
The Earth is not undergoing a historically significant warming, nor is it proven that humanity has had any measurable effect on global climate. In spite of all the apocalyptic scenarios of melting glaciers, rising oceans, and uninhabitable continents presented in the media, the facts simply do not back them up. On the contrary, many scientists express serious doubts that global warming is even happening, much less that it is caused by man.
“Global Warming” Scaremongering
The United Nation’s Intergovernmental Panel on Climate Change (IPCC), in its 2014 Fifth Assessment Report on Climate Change, stated with near absolute certainty that man-made greenhouse gas emissions are “unprecedented in the last 800,000 years” and are “extremely likely to have been the dominant cause of the observed warming since the mid-20th century.”1
Brian Williams of NBC News, summarizing the same report, declared that “unless the world changes course quickly and dramatically, the fundamental systems that support human civilization are at risk.” Tom Brokaw predicted that, if global warming were not stopped, “New York could be abandoned, its famous landmarks lost to the sea.” NASA scientist James Hansen declared that “Boston, Philadelphia, Washington, Miami…they would all be underwater.”
John Hodren, former President Barack Obama’s science czar, said, “As global temperatures rise, they may cause the massive West Antarctic Ice Sheet to slip more rapidly. Then we’ll be facing a sea-level rise not of one to three feet in a century, but of 10 or 20 feet in a much shorter time. The Supreme Court would be flooded. You could tie your boat to the Washington Monument. Storm surges would make the Capitol unusable.”2
10 Razones Por las Cuales el “Matrimonio” Homosexual es Dañino y tiene que Ser Desaprobado
The New York Times published an article titled “The End of Snow?” in which the author made the stunning prediction: “If greenhouse gas emissions continue to rise — they grew 41 percent between 1990 and 2008 — then snowfall, winter and skiing will no longer exist as we know them by the end of the century.”3 In 2000, climate scientist David Viner of the University of East Anglia said that “Children just aren’t going to know what snow is.” In the future, snowfall will be “a very rare and exciting event.”
Echoing the United Nations, an Australian think tank called Breakthrough – National Centre for Climate Restoration published a report on May 30, 2019, that declared “human-induced” global warming to be “the greatest threat to human life on the planet.” It predicts a “high likelihood” that human civilization will end by 2050 if the world does not cut its greenhouse gas emissions. “Planetary and human systems [are] reaching a ‘point of no return’ by mid-century, in which the prospect of a largely uninhabitable Earth leads to the breakdown of nations and the international order,” the report warns.4
Pope Francis has joined this chorus of planetary doom. In a speech on June 13, 2019, he said that climate change “threatens the very future” of humanity, adding that the “doomsday predictions” can no longer be met with disdain. “Deliberations must go beyond mere exploration of what can be done, and concentrate on what needs to be done. We do not have the luxury of waiting for others to step forward, or of prioritizing short-term economic benefits…The climate crisis requires our decisive action, here and now, and the Church is fully committed to playing her part,” the Pope said.5
The Earth’s Climate Has Always Changed and Continues to Do So
One would assume that such stark predictions could only be made on top of rock-solid evidence. Upon further inspection, the case for the global warming theory appears surprisingly weak.
The historical record shows that, long before industrialization, there were long periods of time that saw significant fluctuations in the Earth’s climate. By studying ice core samples, tree rings, and other indicators, scientists can make a rough approximation of the Earth’s average temperature centuries or even millennia ago. Three undisputable historical periods of significant climate change were the Roman Warm Period (250 BC-400 AD), the Medieval Warm Period (800-1200 AD), and the Little Ice Age (1450-1850 AD).6
Temperatures during the Roman and Medieval Warm Periods were as high or higher than they are today. Scientists say that they were 1 degree Celsius higher than the historical average. The Center for the Study of Carbon Dioxide and Global Change reported in 2009 that the “Medieval Warm Period was: (1) global in extent, (2) at least as warm as, but likely even warmer than, the Current Warm Period, and (3) of a duration significantly longer than that of the Current Warm Period to date.”
The Science and Public Policy Institute reported in May 2009: “More than 700 scientists from 400 institutions in 40 countries have contributed peer-reviewed papers providing evidence that the Medieval Warm Period (MWP) was real, global, and warmer than the present. And the numbers grow larger daily.”
 Learn All About the Prophecies of Our Lady of Good Success About Our Times
These warm periods were not just limited to Europe, but the whole planet. According to one study by an international team of climate scientists, the Medieval Warm Period was 0.17°C warmer than the peak warmth of the Current Warm Period and present in South America as well as the Northern Hemisphere.7
Johannes Gutenberg University Mainz published one of the most extensive reconstructions of historical temperature data ever made. It shows both the Roman and Medieval Warm Periods and the Little Ice Age in great detail.8
According to the historical record, agriculture flourished during both Warm Periods. Roman colonists in Ancient Britain planted grapevines, as did Medieval Britons, which grew thanks to the warmer climate. During the Little Ice Age, global temperatures dropped significantly, leading to harsher, colder winters in Europe. Rivers and canals in Britain and the Netherlands froze over with much greater frequency and expanding glaciers in the Swiss Alps even destroyed whole villages. These historical variations in climate are well-documented cases of natural variability in the Earth’s climate.
Increase in Global Average Temperature…But Who’s Measuring and How?
According to data collected by United States National Oceanic and Atmospheric Administration (NOAA), the Earth’s global average temperature increased by 0.74°C ± 0.18°C between 1906 and 2005. This warming occurred in two periods: from about 1910-1950 (at which time it decreased for about 30 years) and again from 1980-1998. After 1998, global average temperature remained stable.
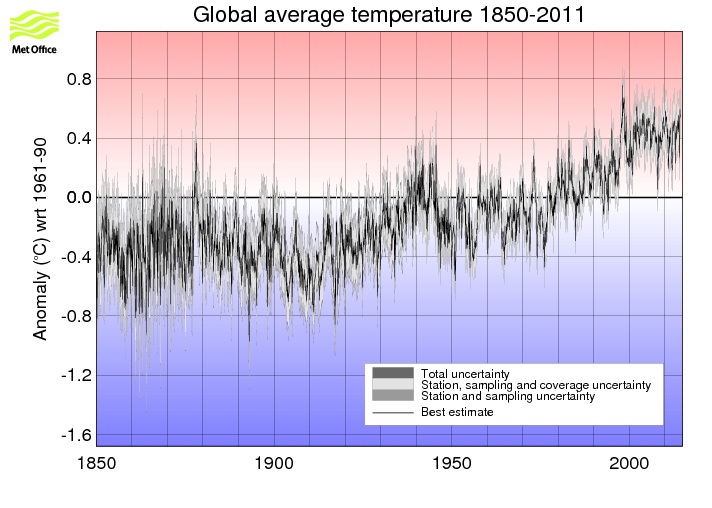
Since the middle of the nineteenth century, scientists have collected temperature data using weather stations placed all over the world. There is no dispute that the average temperature across the Earth has increased slightly in the past century. There is, however, much controversy over how this raw temperature data has been “adjusted” by scientists if calculating a “global temperature” is meaningful or even possible, what has caused this warming, and what (if any) effects on human civilization such continued warming might have.
Unreliability of Weather Station Temperature Data
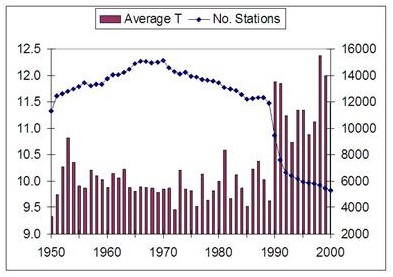
From 1850 until 1960, the number of weather stations around the world used for measuring world climate increased from just a few hundred in the United States and Europe to approximately 6,000. These stations collect a series of weather data points such as maximum and minimum temperature, humidity, and precipitation. Various scientific bodies collect it in vast databases.
Beginning in the 1960s, the number of stations dropped dramatically, to about 1,500 today. Most of the decrease occurred in the former Soviet Union, China, Africa, and South America. Today, more than 50% of all stations worldwide are located in the United States, and 69% are in the Northern Hemisphere, mostly in North America, Western Europe, and Japan.
Over the past century, many stations were shut down and then reopened years later due to political upheaval or other reasons. Some have changed location over the years. Very few stations have continuously recorded from the same location for the last century or more. This decrease has caused major gaps in temperature data around the world, gaps that scientists fill in with estimates using algorithms. The following maps show the change in weather station coverage in 1900, 1976, and 1997.
Eternal and Natural Law: The Foundation of Morals and Law

The massive decrease in weather stations in the 1990s coincided with an increase in global average temperature in that decade. Some scientists believe that the disappearance of weather stations in colder places (like the former Soviet Union) and the consolidation of stations in Western countries in more urban (and therefore warmer) locations has artificially raised the temperature data collected by the weather stations. One study by Willmott, Robeson and Feddema (“Influence of Spatially Variable Instrument Networks on Climatic Averages,” Geophysical Research Letters, Vol. 18 No. 12, pp. 2249-2251, Dec 1991) calculated a +0.2°C bias in the global average due to pre-1990 station closures.
The Cynical Myth of a Global Warming “Consensus”
Some scientists have questioned the reliability of these weather stations. In 2015, the NOAA closed more than 600 out of 9,000 weather stations across the United States because of poor maintenance or proximity to “heat sinks.” Heat sinks are structures such as buildings, asphalt, or machinery that stores heat during the day and emits it at night, thereby artificially raising the ambient temperature.9 Scientist Anthony Watts has compiled a database of weather stations in the United States complete with pictures and a rating of its reliability. Some stations are located right next to heat-emitting structures such as parking lots, buildings, roads, air conditioning units, cell-phone towers, airport runways, and even a sewage treatment plant.10
The “urban heat effect” has also been a factor in the rise in recorded temperatures. Cities, due to the presence of buildings, concrete, asphalt, machinery, can have a local temperature several degrees higher than the surrounding rural area. Since the 1990s, a higher and higher percentage of weather stations have been located in cities, and large numbers of rural weather stations have closed. As urban areas such as Los Angeles, Atlanta, and Miami have grown significantly over the last century, so have their average ambient temperatures.
Satellites and Surface Weather Stations Show Different Temperatures
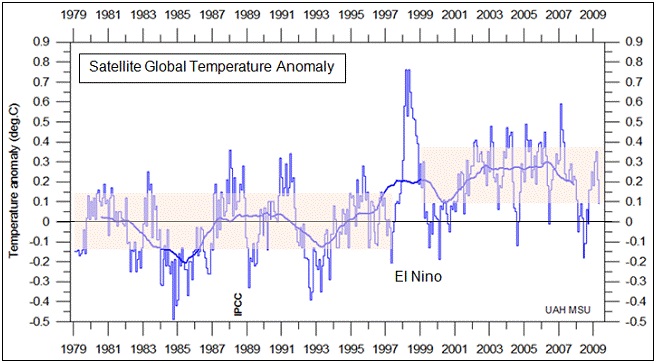
Scientists have used satellites to measure atmospheric temperature since 1979. Because satellite data only goes back forty years, it is less useful than surface weather station data (which goes back to the middle of the nineteenth century). However, satellite measurements have cast doubt on the twentieth-century warming trend.
Although ground stations have shown some warming in the twentieth century, satellite data has shown no significant warming since 1979. Following the exceptional El Niño of 1998, there was a residual warming following by virtually no warming until today.
Satellite temperatures are considered more reliable than ground weather stations. At a minimum, the significant difference between the two data sets calls into question the accuracy of our temperature data, if not the whole global warming theory.
“Adjusting” the Temperature Data
Weather stations record the maximum and minimum surface temperatures each day and calculate the average temperature. With the daily data, the average temperature for the month is calculated, and with the monthly data, the average temperature for the whole year.
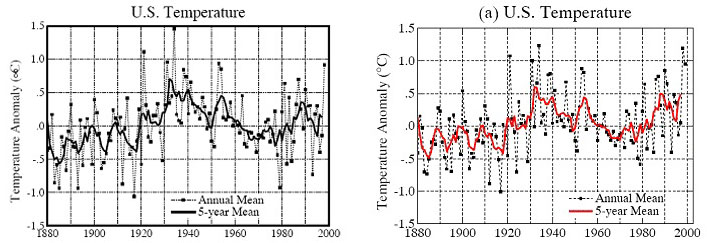
However, to calculate the “average” temperature over a given region, country, or the whole planet, scientists do not use the raw weather station data. Different scientific agencies run complex “adjustments” to modify that data. For example, nearby stations’ data are compared and homogenized if temperature trends vary. Some of these “adjustments appear to artificially inflate recorded temperatures.”
The following two graphs show the average temperatures for the United States as calculated by NASA. The first graph shows the temperature calculated in 1999, and the second using an “updated” adjustment method created by NASA in 2001. The second indicates a much higher average temperature, even though the underlying raw data is exactly the same.
“Global Average Temperature” Is Itself a Questionable Statistic
Scientific agencies such as NASA develop complex formulae to calculate a single number for the whole planet, a “global average temperature.” Although such a number may seem convenient, in reality, the global climate—like the global economy, global health, or global crime—is so complex as to be nearly impossible to reduce to a single number.
It is simply a fact that global warming is not global. While the Northern Hemisphere has undergone a slight warming over the last 40 years or so, the Southern Hemisphere has remained stable or even slightly cooled, depending on how it is measured. According to satellite data going back to 1979, the Northern Hemisphere warmed by 0.5°C, the Southern Hemisphere by 0.1°C, and the Tropics saw no change in temperature.11
Temperature over Antarctica has remained stable for decades. The Antarctic ice sheet has grown significantly since satellite observations began in the 1970s, reaching an all-time record high in 2014. This contradicts the warnings of climate alarmists, who predicted that global warming would cause a melting of Antarctic ice, thereby flooding coastal cities.
In fact, over the past half-century, most of the warming detected in the Northern Hemisphere can be attributed almost entirely to that which has taken place in the Arctic. Global warming is not the uniform phenomenon that climate alarmists portray.
Little to No Warming Since 1998
From 1988 to the present day, mankind has produced more than half of all the greenhouse gas emissions that have been emitted since the dawn of the Industrial Revolution in the eighteenth century. The UN’s IPCC has named these man-made greenhouse gases as the primary culprit behind global warming. If true, we would expect the Earth’s climate to have warmed considerably since the 1980s.
Computer model predictions by NOAA, NASA, and the UN’s IPCC in the 1990s and early 2000s predicted just that. The IPCC’s First Assessment Report in 1990 anticipated a warming of 0.3°C per decade and an increase of 1°C by 2025.12
This warming has not occurred. Instead, since 1979, the world has warmed by only half that rate and, following an exceptionally hot year in 1998, global temperatures since then have remained steady or increased slightly.
What Happens When Al Gore’s Inconvenient Truths Face the Facts
“So far, no one has been able to provide a compelling answer to why climate change seems to be taking a break,” IPCC Lead Author Hans von Storch told Der Spiegel in a June 2013 interview. “According to most climate models, we should have seen temperatures rise by around 0.25 degrees Celsius (0.45 degrees Fahrenheit) over the past ten years. That hasn’t happened. In fact, the increase over the last 15 years was just 0.06 degrees Celsius (0.11 degrees Fahrenheit) — a value very close to zero,” Storch told Der Spiegel. “This is a serious scientific problem that the Intergovernmental Panel on Climate Change (IPCC) will have to confront when it presents its next Assessment Report late next year.”13
The following graph shows the satellite data for global average temperatures.14

This graph shows the yearly satellite temperature fluctuations compared from 1979 to 2019, based on the average temperature from 1981-2010. Temperatures have either increased slightly or remained stable since 1998.15

Conclusion
Scientists are far from proving that the Earth is warming in any historically significant way, and even farther from proving that mankind is causing it. On the contrary, by historical standards, the Earth’s temperature over the past century has been remarkably stable. Although many weighty scientific bodies have lent their support to the man-made global warming theory, many scientists are skeptical. There are serious questions about the way climate data is collected and how that data is “adjusted” by NASA, NOAA, and the University of East Anglia Climatic Research Unit. The Earth’s climate is immensely complex, with many factors (notably the sun) playing big roles.
Science Confirms: Angels Took the House of Our Lady of Nazareth to Loreto
There is still much that we do not know about what causes changes in the Earth’s climate, and even less about man’s influence (if any) on it. It is absurd for global warming alarmists to push for political and economic change based on such weak evidence. Worse still is Pope Francis, who is lending the power and influence of the Vatican to help this misguided cause. Reasonable observers in America, Europe, and across the world have the right to be skeptical.
Footnotes
- https://archive.ipcc.ch/pdf/assessment-report/ar5/syr/AR5_SYR_FINAL_SPM.pdf.
- Marc Morano, The Politically Incorrect Guide to Climate Change, (Regnery, 2018), p. 13.
- https://www.nytimes.com/2014/02/08/opinion/sunday/the-end-of-snow.html.
- http://www.climatecodered.org/2019/05/can-we-think-in-new-ways-about.html.
- https://cruxnow.com/vatican/2019/06/14/pope-to-oil-execs-we-dont-have-the-luxury-to-wait-to-fight-climate-change/.
- http://www.co2science.org/subject/r/summaries/rwpeurope.php.
- https://www.c3headlines.com/2011/12/manns-discredited-hockey-stick-takes-another-huge-hit-south-americas-hot-medieval-temperatures.html.
- http://www.uni-mainz.de/eng/15491.php.
- https://www.foxnews.com/science/distorted-data-feds-close-600-weather-stations-amid-criticism-theyre-situated-to-report-warming.
- Anthony Watts, Is the U.S. Surface Temperature Record Reliable? (Chicago, IL: The Heartland Institute, 2009). https://wattsupwiththat.files.wordpress.com/2009/05/surfacestationsreport_spring09.pdf.
- http://appinsys.com/GlobalWarming/GW_NotGlobal.htm.
- https://www.ipcc.ch/site/assets/uploads/2018/03/ipcc_far_wg_I_spm.pdf.
- https://www.spiegel.de/international/world/interview-hans-von-storch-on-problems-with-climate-change-models-a-906721.html.
- http://climate4you.com/.
- http://www.drroyspencer.com/latest-global-temperatures/.